A few years ago, I sat across from a bank manager who looked at our chicken farm’s profit numbers and smiled. “Good profits,” he said. Then he flipped to the cash flow page and his expression changed. “But where’s your cash?”
That moment taught me something I wish someone had explained earlier — profit and cash are not the same thing. Your P&L can show millions in profit, but if your actual cash balance is negative, you can’t pay your feed supplier, you can’t pay salaries, and your farm grinds to a halt.
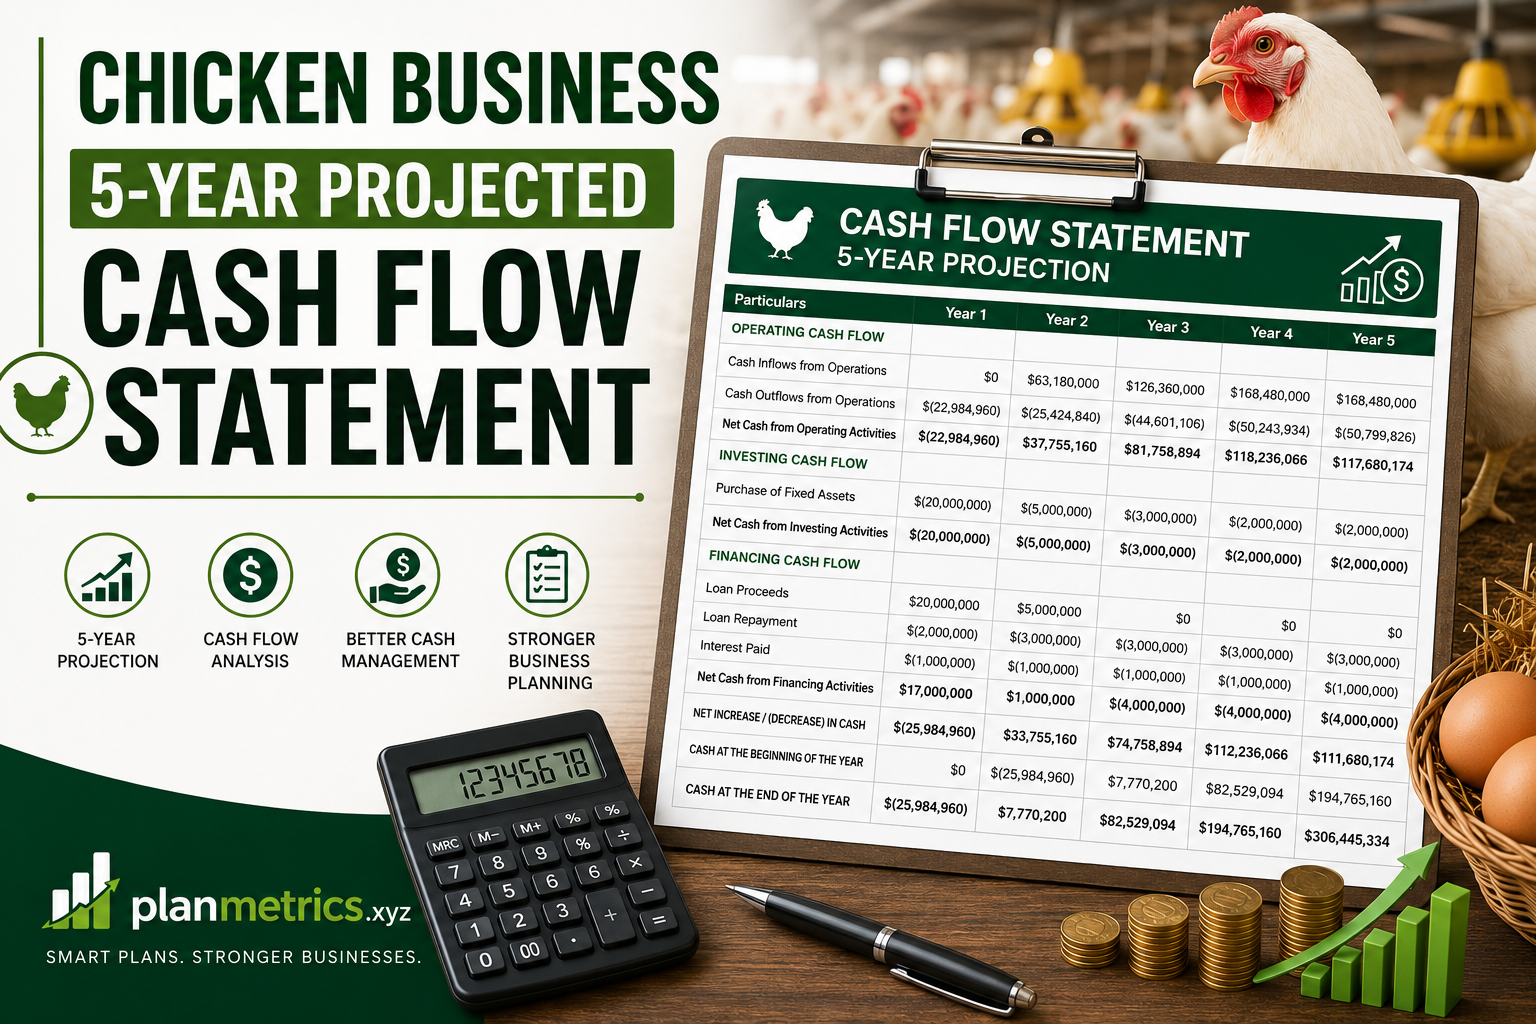
That’s exactly why a Cash Flow Statement is just as important — maybe even more important — than your Profit & Loss Statement. And when you’re planning a chicken business over 5 years, this document becomes your financial survival guide.
Let me walk you through every section of a real 5-year projected cash flow statement for a chicken farm, using actual numbers so you understand exactly what each line means.
What Is a Projected Cash Flow Statement?
Think of it this way: your P&L statement tells you if your business is profitable. Your cash flow statement tells you if your business can actually survive day to day.
A projected cash flow statement tracks three things:
- How much cash comes in (from operations, investors, loans)
- How much cash goes out (for assets, repaying loans, running costs)
- What your cash balance looks like at the start and end of each year
For a chicken farm, this matters enormously because there’s a huge gap between when you spend money (buying chicks, feed, equipment) and when you receive money (selling mature birds). That gap is your cash flow risk.
Cash Balance Overview (Year 1 to Year 5)
Let’s start with the big picture — the cash balance section at the top of the statement:
| Year 1 | Year 2 | Year 3 | Year 4 | Year 5 | |
|---|---|---|---|---|---|
| Cash at Beginning of Period | $0 | -$14,083,160 | $16,175,811 | $82,746,899 | $175,422,900 |
| Cash Inflows/Outflows During Year | -$14,083,160 | $30,258,971 | $66,571,088 | $92,676,000 | $72,167,359 |
| Cash at End of Period | -$14,083,160 | $16,175,811 | $82,746,899 | $175,422,900 | $247,590,259 |
Year 1 ends with negative $14 million in cash — the farm is technically in a cash deficit. But by Year 2, it swings to a positive $16.1 million, and by Year 5, the business is sitting on nearly $247.6 million in cumulative cash.
That swing from -$14M to +$247M over 5 years is the story of a well-structured chicken business going from investment phase to full-scale profitable operation.
Cash Flow from Operating Activities
This section shows the cash generated from the actual day-to-day chicken farming business — not loans, not asset purchases, just operations.
| Year 1 | Year 2 | Year 3 | Year 4 | Year 5 | |
|---|---|---|---|---|---|
| Net Profit After Tax | -$4,084,960 | $32,612,171 | $66,824,288 | $90,829,200 | $90,320,559 |
| Adjustments: | |||||
| Depreciation | $1,846,800 | $1,846,800 | $1,846,800 | $1,846,800 | $1,846,800 |
| Inventory – Chicken | -$2,100,000 | -$4,200,000 | -$2,100,000 | $0 | $0 |
| Accrued Liabilities | $0 | $0 | $0 | $0 | $0 |
| Net Cash from Operating Activities | -$4,338,160 | $30,258,971 | $66,571,088 | $92,676,000 | $92,167,359 |
Breaking This Down
Net Profit After Tax is pulled directly from your P&L statement. Year 1 is a loss of $4.08 million, then it grows rapidly from Year 2 onwards.
Depreciation is added back — and this confuses a lot of new farm owners. Depreciation is a non-cash expense. You recorded it on your P&L to reduce taxable income, but no actual cash left the bank. So in cash flow, we add it back. Every year, $1,846,800 comes back into your cash picture because of this.
Inventory – Chicken is the interesting one. In Year 1, the farm builds up $2.1 million worth of live chicken inventory. In Year 2, that doubles to $4.2 million as the operation scales. This cash is “locked up” in birds that haven’t been sold yet — which is why your cash balance takes a hit even when operations are running.
By Year 4 and 5, inventory adjustments drop to zero — the farm has reached steady state and isn’t building up new inventory levels, just cycling through.
The key takeaway: Even though Year 1 shows a net loss of $4 million, the operating cash outflow is only $4.3 million — depreciation partially cushions the blow.
Cash Flow from Investing Activities
This is where the farm’s major physical investments appear.
| Year 1 | Year 2 | Year 3 | Year 4 | Year 5 | |
|---|---|---|---|---|---|
| Purchase of Assets | -$65,745,000 | $0 | $0 | $0 | $0 |
| Net Cash from Investing Activities | -$65,745,000 | $0 | $0 | $0 | $0 |
Year 1 shows a massive $65.74 million outflow for asset purchases. This is the farm being built — land, poultry houses, feeding systems, water systems, refrigeration units, vehicles, processing equipment. Everything needed to run a large-scale chicken operation gets purchased in Year 1.
From Year 2 onwards, investing activities are zero. The infrastructure is in place. No major new capital expenditure is needed because the existing assets are being depreciated over their useful life.
This is a common pattern in capital-intensive farming businesses — huge upfront investment, then years of operational returns. It’s exactly why your cash balance craters in Year 1 and why you need financing to bridge that gap.
Mistake to avoid: Some farm owners try to spread asset purchases across multiple years to “soften” the cash flow impact. While this can work for non-essential upgrades, core farm infrastructure should be built completely before you start operations. Incomplete infrastructure leads to inefficiency, bird losses, and ultimately more cost.
Cash Flow from Financing Activities
This is where the money comes from to fund everything — equity (your own investment), loans, and government support.
| Year 1 | Year 2 | Year 3 | Year 4 | Year 5 | |
|---|---|---|---|---|---|
| Equity | $1,000,000 | $0 | $0 | $0 | $0 |
| Loan-1 | $20,000,000 | $0 | $0 | $0 | -$20,000,000 |
| Government Loan | $35,000,000 | $0 | $0 | $0 | $0 |
| Net Cash from Financing Activities | $56,000,000 | $0 | $0 | $0 | -$20,000,000 |
Year 1 brings in $56 million in financing:
- $1 million from owner equity (personal investment)
- $20 million from a commercial loan (Loan-1)
- $35 million from a government loan (likely an agricultural development program)
This $56 million, combined with the operating situation, is what funds the $65.7 million in asset purchases and covers early operating losses.
In Year 5, Loan-1 is repaid — $20 million goes back out. This is why Year 5’s net cash flow ($72.1 million) is lower than Year 4’s ($92.6 million) even though operations are at the same scale. The loan repayment takes a significant chunk out of cash.
This is something farms often don’t plan for properly. Your Year 5 cash looks great on the surface, but if a major loan repayment lands that year, your available cash shrinks fast.
Net Cash Flow Summary
| Year 1 | Year 2 | Year 3 | Year 4 | Year 5 | |
|---|---|---|---|---|---|
| NET CASH FLOW | -$14,083,160 | $30,258,971 | $66,571,088 | $92,676,000 | $72,167,359 |
| Cash at Beginning of Period | $0 | -$14,083,160 | $16,175,811 | $82,746,899 | $175,422,900 |
| Cash Inflows/Outflows During Year | -$14,083,160 | $30,258,971 | $66,571,088 | $92,676,000 | $72,167,359 |
| Cash at End of Period | -$14,083,160 | $16,175,811 | $82,746,899 | $175,422,900 | $247,590,259 |
The net cash flow tells the complete story:
- Year 1: -$14 million (investment phase — expected and planned for)
- Year 2: +$30.2 million (operations kick in, loans already secured)
- Year 3: +$66.5 million (scaling up strongly)
- Year 4: +$92.6 million (peak cash generation year)
- Year 5: +$72.1 million (strong but reduced due to $20M loan repayment)
Cumulative cash at end of Year 5: $247.59 million. That’s the compounding effect of a well-run farming operation over half a decade.
5-Year Cash Flow Trend Analysis
Looking at these 5 years together, there are three distinct phases:
Phase 1 — Investment (Year 1): Spend big, earn nothing, rely entirely on financing. Cash goes deeply negative. This is normal and expected for any serious farm setup. Don’t panic. Plan for it.
Phase 2 — Growth (Years 2–3): Operations start generating real cash. The farm pays for itself. Cash balance climbs from negative territory to $82.7 million by end of Year 3. This is the most exciting phase — you see everything starting to work.
Phase 3 — Maturity (Years 4–5): Revenue plateaus, operations are optimized, cash accumulates steadily. The only disruption is the Year 5 loan repayment, but the business handles it comfortably.
How to Prepare a Cash Flow Statement for Your Chicken Farm
Here’s the practical step-by-step process:
Step 1: Start with your opening cash balance. For a new farm, this is $0. For an existing farm, it’s your bank balance at the start of the year.
Step 2: Calculate operating cash flow. Take your net profit from your P&L, add back depreciation (non-cash), then adjust for any changes in inventory or payables.
Step 3: List all investing activities. Every major asset purchase goes here — land, buildings, equipment. These are capital expenditures, not operating expenses.
Step 4: List all financing activities. New loans received, equity injections, loan repayments — all in this section. Inflows are positive, repayments are negative.
Step 5: Add all three sections together. Operating + Investing + Financing = Net Cash Flow for the year.
Step 6: Calculate closing cash balance. Opening balance + Net Cash Flow = Closing balance. This closing balance becomes next year’s opening balance.
Step 7: Stress test your projections. What if feed prices rise 15%? What if chicken prices drop 10%? Run scenarios and see how your cash balance holds up. This is where tools like Excel or Google Sheets become invaluable.
Common Cash Flow Mistakes Chicken Farmers Make
Not separating cash from profit. I’ve said it before and I’ll say it again — these are two different things. Always prepare both statements.
Forgetting loan repayment timing. Loans feel like free money when they arrive. They don’t feel that way when repayment starts. Map out every repayment date across your 5-year projection.
Underestimating the inventory cash trap. Growing birds costs money before they generate any. Factor in the cash tied up in live inventory at every growth stage.
No buffer for emergencies. Disease outbreaks, extreme weather, feed shortages — any of these can hit your cash hard. A 3–6 month cash buffer should be part of your plan.
Ignoring government loan conditions. Government agricultural loans often come with conditions — specific uses, reporting requirements, repayment schedules. Know these terms cold before you sign.
Final Thoughts
When I showed my updated cash flow projection to that same bank manager a year later, his reaction was completely different. He leaned back in his chair and said, “Now this is a business plan.”
A 5-year cash flow statement for a chicken farm is more than just numbers on a spreadsheet. It’s proof that you understand your business — not just the optimistic revenue side, but the hard reality of when money comes in, when it goes out, and how much you need in reserve to stay standing.
The numbers in this projection show a chicken business that loses cash in Year 1, recovers strongly in Year 2, scales powerfully through Year 3, peaks in Year 4, and handles a major loan repayment in Year 5 without breaking a sweat. That’s not luck — that’s planning.
Build your cash flow statement before you spend your first dollar on infrastructure. It will tell you exactly how much financing you need, when you’ll become cash-positive, and whether your business model actually works in the real world. No guessing. Just clarity.