My uncle once told me, “Numbers don’t lie, but farmers often ignore them.” He ran a small poultry farm for over a decade and never once sat down to write out a proper profit and loss statement. He just “felt” like he was making money. Then one bad year — disease outbreak, feed prices spiked, a couple of bad contracts — and he nearly lost everything.
That experience is what pushed me to take farm finances seriously when I started helping manage our own chicken operation. I built out a full 5-year financial projection, and honestly, it changed the way I looked at farming entirely. Let me walk you through what I learned, what the numbers looked like, and how you can do this for your own poultry business.
What Is an Annual Profit and Loss Statement?
Most farmers think of a P&L statement as something accountants deal with. But it’s really just a one-page answer to the question: Did we make or lose money this year — and why?
A profit and loss (P&L) statement summarizes your revenue, costs, and net income over a specific period — in this case, annually across five years. It tells you:
- How much you earned from chicken sales
- What you spent on feed, chicks, labor, utilities, and everything else
- Whether you’re actually profitable — not just cash-flow positive
The key sections are: Revenue → Cost of Sales → Gross Profit → Operating Expenses → Profit Before Tax → Tax → Net Profit. That’s the skeleton every chicken farm P&L follows.
Annual Revenue Analysis
In our 5-year projection model, the farm starts with $0 in Year 1 — which makes sense because the first year is mostly setup, construction, sourcing suppliers, and getting the first flock ready. There’s no income until operations actually begin.
By Year 2, chicken sales jump to $63,180,000, and the growth curve steepens fast:
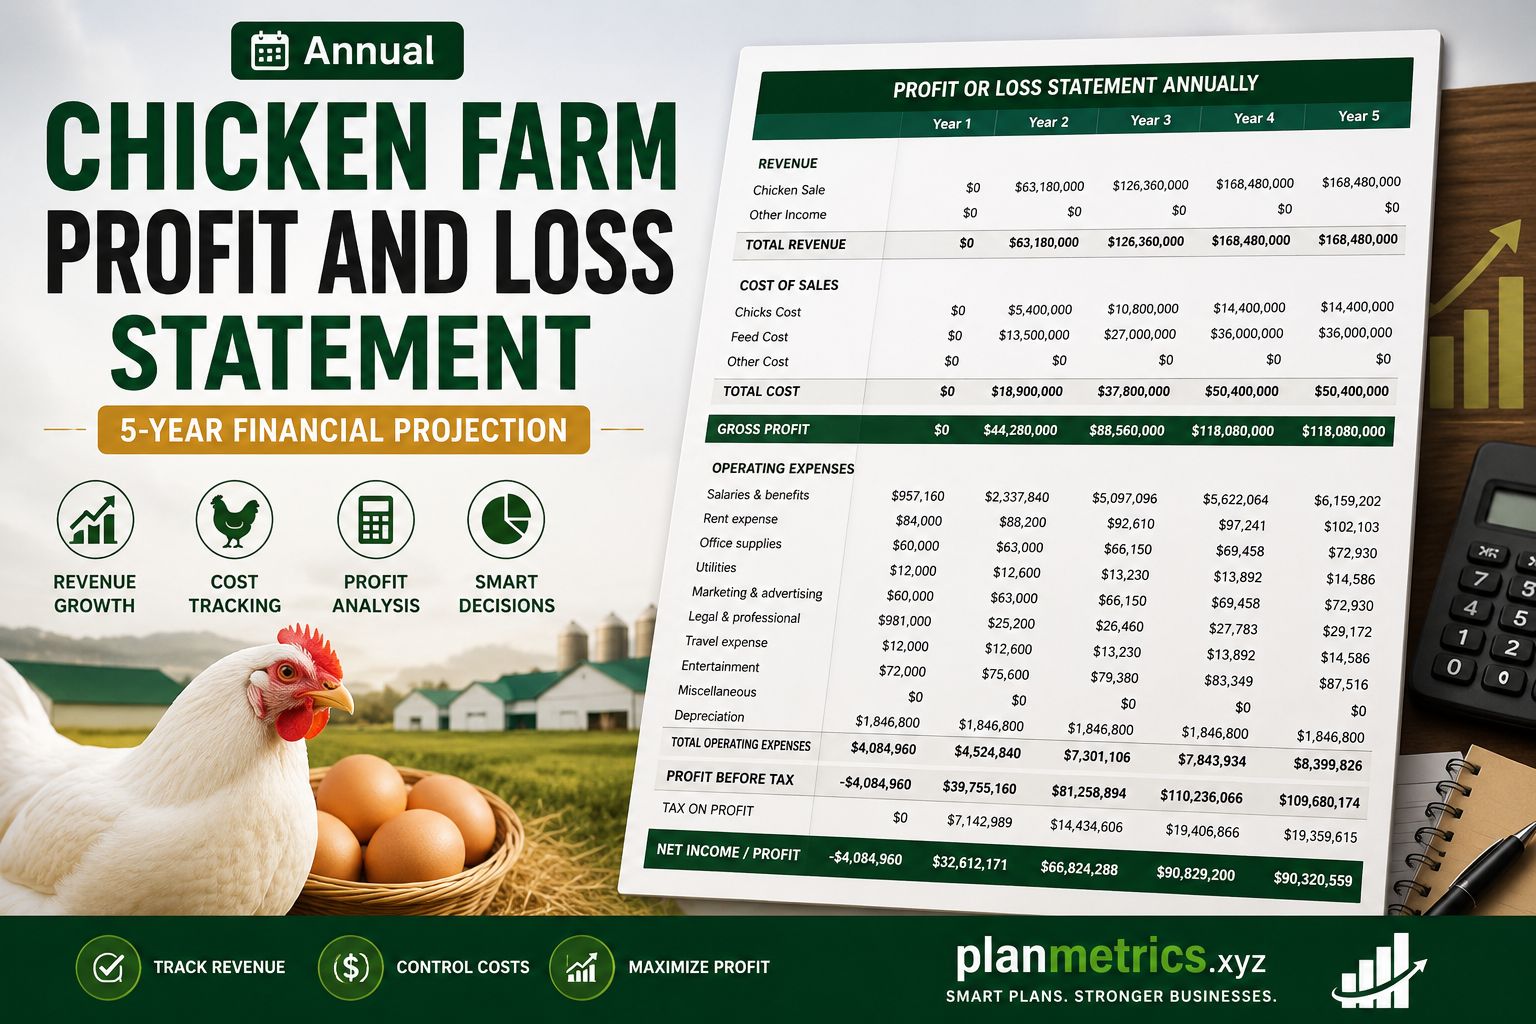
| Profit or loss Statement | Year 1 | Year 2 | Year 3 | Year 4 | Year 5 | |
| Revenue | ||||||
| Chicken Sale | $0 | $63,180,000 | $126,360,000 | $168,480,000 | $168,480,000 | |
| Other Income | $0 | $0 | $0 | $0 | $0 | |
| Total Revenue | $0 | $63,180,000 | $126,360,000 | $168,480,000 | $168,480,000 |
Notice how Year 3 doubles Year 2, then Year 4 jumps again, and Year 5 plateaus. This is realistic — you scale aggressively in the early years, then hit your operational capacity and maintain. Other income stays at $0 across all years, which tells us this is a pure chicken-sale business, no eggs or by-products being monetized.
One mistake I see a lot of new farm operators make? They project revenue based on current market prices without accounting for seasonal price drops or oversupply. If you’re selling broilers, build in a conservative buffer of 5–10% below your expected contract price.
Annual Cost of Sales Breakdown
Your cost of sales is the direct cost of producing your chickens — the stuff you can’t avoid if you want birds to sell.
In our projection:
| Year | Chicks Cost | Feed Cost | Other Cost | Total Cost |
|---|---|---|---|---|
| Year 1 | $0 | $0 | $0 | $0 |
| Year 2 | $5,400,000 | $13,500,000 | $0 | $18,900,000 |
| Year 3 | $10,800,000 | $27,000,000 | $0 | $37,800,000 |
| Year 4 | $14,400,000 | $36,000,000 | $0 | $50,400,000 |
| Year 5 | $14,400,000 | $36,000,000 | $0 | $50,400,000 |
Feed is always the monster in poultry farming — it consistently accounts for roughly 71–75% of your total cost of sales. In Year 2, feed is $13.5M versus $5.4M for chicks. That ratio holds throughout the projection.
This is where a lot of farm owners get blindsided. They budget for chick costs because it feels like the obvious “raw material,” but feed is what will break your margins if prices shift. During COVID-19, corn and soybean prices went haywire and farms that hadn’t locked in feed contracts took massive hits.
Lesson learned the hard way: Always negotiate long-term feed supply agreements when launching or scaling. Even a slightly higher locked-in rate gives you budget certainty.
Annual Gross Profit Overview
Gross profit is simply your revenue minus cost of sales. It tells you how much you’re making from the actual farming activity before you start paying for salaries, rent, utilities, and other operational overhead.
| Year | Revenue | Total Cost | Gross Profit |
|---|---|---|---|
| Year 1 | $0 | $0 | $0 |
| Year 2 | $63,180,000 | $18,900,000 | $44,280,000 |
| Year 3 | $126,360,000 | $37,800,000 | $88,560,000 |
| Year 4 | $168,480,000 | $50,400,000 | $118,080,000 |
| Year 5 | $168,480,000 | $50,400,000 | $118,080,000 |
The gross profit margin sits at roughly 70% across Years 2–5. That’s a strong margin for an agricultural operation — it means for every dollar of chicken sold, about 70 cents remains to cover operating costs and profit.
But don’t let that 70% fool you into feeling comfortable. The operating expenses layer comes next, and it’s significant.
Annual Operating Expenses Explained
This is where the real complexity lives. Operating expenses are everything it costs to run the business beyond direct production — the salaries, rent, utilities, marketing, and so on.
Here’s how the numbers break down across five years:
| Expense Category | Year 1 | Year 2 | Year 3 | Year 4 | Year 5 |
|---|---|---|---|---|---|
| Salaries & Benefits | $957,160 | $2,337,840 | $5,097,096 | $5,622,064 | $6,159,202 |
| Rent Expense | $64,000 | $88,200 | $92,610 | $97,241 | $102,103 |
| Office Supplies | $60,000 | $63,000 | $66,150 | $69,458 | $72,930 |
| Utilities | $12,000 | $12,600 | $13,230 | $13,892 | $14,586 |
| Marketing & Advertising | $60,000 | $63,000 | $66,150 | $69,458 | $72,930 |
| Legal & Professional | $901,000 | $25,200 | $26,460 | $27,703 | $29,172 |
| Travel Expense | $12,000 | $12,600 | $13,230 | $13,892 | $14,586 |
| Entertainment | $72,000 | $75,600 | $79,380 | $83,349 | $87,516 |
| Miscellaneous | $0 | $0 | $0 | $0 | $0 |
| Depreciation | $1,846,800 | $1,846,800 | $1,846,800 | $1,846,800 | $1,846,800 |
| Total Operating Expenses | $4,084,960 | $4,524,840 | $7,301,106 | $7,843,934 | $8,399,826 |
A few things stand out here:
Salaries are the fastest-growing cost. They go from under $1M in Year 1 to over $6M by Year 5. As the farm scales, you need more workers, supervisors, vets, and management staff. This is normal, but it needs to be planned for.
Legal & Professional is sky-high in Year 1 ($901,000) and drops to $25,000+ in subsequent years. This is typical — startup legal work (incorporation, contracts, permits, environmental compliance) is expensive and front-loaded.
Depreciation is flat at $1,846,800 every year. This represents the annual write-down of equipment, buildings, and infrastructure. It’s a non-cash expense, which means it reduces your taxable profit without actually taking cash out of the business. Very important for tax planning.
Annual Profit Before Tax
After subtracting operating expenses from gross profit, we get to profit before tax (PBT):
| Year | Gross Profit | Operating Expenses | Profit Before Tax |
|---|---|---|---|
| Year 1 | $0 | $4,084,960 | -$4,084,960 |
| Year 2 | $44,280,000 | $4,524,840 | $39,755,160 |
| Year 3 | $88,560,000 | $7,301,106 | $81,258,894 |
| Year 4 | $118,080,000 | $7,843,934 | $110,236,066 |
| Year 5 | $118,080,000 | $8,399,826 | $109,680,174 |
Year 1 is a loss of $4.08 million — but that’s not a red flag. It’s expected. Any serious farm operation will run at a loss in its setup year because you’re spending money before you’ve sold a single bird. Investors and lenders know this.
From Year 2 onwards, the pre-tax profit is strong and growing. Year 5’s slight dip from Year 4 reflects the plateau in revenue combined with slightly higher operating costs.
Annual Tax Calculation
Taxes are calculated only when there’s actual profit — and as you’d expect, Year 1 has zero tax because it’s a loss year.
| Year | Tax on Profit |
|---|---|
| Year 1 | $0 |
| Year 2 | $7,142,989 |
| Year 3 | $14,434,606 |
| Year 4 | $19,406,866 |
| Year 5 | $19,359,615 |
The effective tax rate works out to roughly 17–18% across profitable years, which is reasonable for a corporate farming entity. This will vary depending on your country, tax jurisdiction, applicable agricultural incentives, and entity structure (sole proprietor vs. LLC vs. corporation).
One thing to flag: always work with a tax professional who has agribusiness experience. Agricultural tax rules are complicated — depreciation schedules on farm equipment, livestock deductions, rural investment credits — these can all reduce your bill significantly if applied correctly.
Annual Net Profit Analysis
After taxes, here’s the bottom line — what the business actually keeps:
| Year | Net Income / Profit |
|---|---|
| Year 1 | -$4,084,960 |
| Year 2 | $32,612,171 |
| Year 3 | $66,824,288 |
| Year 4 | $90,829,200 |
| Year 5 | $90,320,559 |
Year 2’s net profit of $32.6 million is honestly remarkable for a second-year farming operation. By Year 4 and 5, you’re clearing over $90 million annually after tax. These are numbers that reflect a large-scale commercial chicken operation — not a backyard coop.
What this also tells you is the payback period. Year 1 loses about $4M. Year 2 nets $32M. The initial losses are recovered in the first half of Year 2 — which is an excellent return on a farming investment.
5-Year Chicken Farm Financial Forecast
Let’s zoom out and look at the full picture:
| Metric | Year 1 | Year 2 | Year 3 | Year 4 | Year 5 |
|---|---|---|---|---|---|
| Total Revenue | $0 | $63.18M | $126.36M | $168.48M | $168.48M |
| Total Cost of Sales | $0 | $18.9M | $37.8M | $50.4M | $50.4M |
| Gross Profit | $0 | $44.28M | $88.56M | $118.08M | $118.08M |
| Total Operating Expenses | $4.08M | $4.52M | $7.3M | $7.84M | $8.4M |
| Profit Before Tax | -$4.08M | $39.75M | $81.26M | $110.24M | $109.68M |
| Net Profit | -$4.08M | $32.61M | $66.82M | $90.83M | $90.32M |
The trend is clear: losses only in the first year, then rapid scaling through Years 2 and 3, with stabilization by Years 4 and 5. If I were presenting this to a bank or an investor, this projection would tell a very compelling story — provided your assumptions on chicken sale prices and operational scale are grounded in market reality.
How to Prepare an Annual Profit and Loss Statement
Here’s the honest step-by-step process I actually use:
Step 1: Define your reporting period. Decide if you’re doing calendar year (January–December) or fiscal year. Most farms use calendar year for simplicity.
Step 2: Record all revenue. Pull from your invoices, contracts, and bank statements. Don’t estimate — use actual figures or firm contracts.
Step 3: Calculate cost of sales. This means chick purchase costs, feed costs, veterinary drugs, and any other direct cost tied to producing your birds. Keep these separate from operating costs.
Step 4: Calculate gross profit. Revenue minus cost of sales. Simple subtraction, but this number tells you your core farming margin.
Step 5: List all operating expenses. Go category by category — payroll, rent, utilities, marketing, insurance, legal, travel, depreciation. Use bank statements, receipts, and payroll records. Tools like QuickBooks, Wave (free), or Xero are great for this.
Step 6: Calculate profit before tax. Gross profit minus total operating expenses.
Step 7: Apply your tax rate. Work with your accountant on the correct applicable rate and any deductions or credits you qualify for.
Step 8: Calculate net profit. Profit before tax minus taxes paid. This is the number that matters.
Step 9: Review and compare. Compare against prior years or your original projections. Where did you overspend? Where did revenue fall short? This review is where the real value of the P&L lies.
Step 10: Repeat and refine. The first P&L you make will have gaps. By Year 3 of doing this, your projections will be much tighter and your financial decision-making much sharper.
Common Mistakes to Avoid
Mixing personal and business expenses. I’ve seen this wreck small farm finances. Keep separate accounts from Day 1.
Forgetting depreciation. New equipment, farm buildings, vehicles — these all depreciate. Leaving this off your P&L overstates your profit and creates a nasty tax surprise.
Overestimating revenue in early years. Markets take time to develop. First-year projections should be conservative.
Ignoring seasonality. Chicken prices fluctuate. If your P&L treats every month equally, your cash flow will catch you off guard.
Not tracking feed price changes monthly. Feed is your biggest variable cost. Track it obsessively.
Wrapping Up
My uncle eventually did sit down and build out a proper P&L — three years after nearly going under. He said it felt like “finally turning the lights on in a dark room.” Everything that had been vague and stressful became concrete and manageable.
A 5-year chicken farm profit and loss statement isn’t just paperwork. It’s a map. It tells you where you’ve been, where you are, and — if your assumptions are solid — where you’re headed. Whether you’re pitching to a lender, evaluating a business partner, or just trying to decide whether to expand your flock, this document gives you the clarity to make that call with confidence.
Build it once, update it every year, and let the numbers guide you.