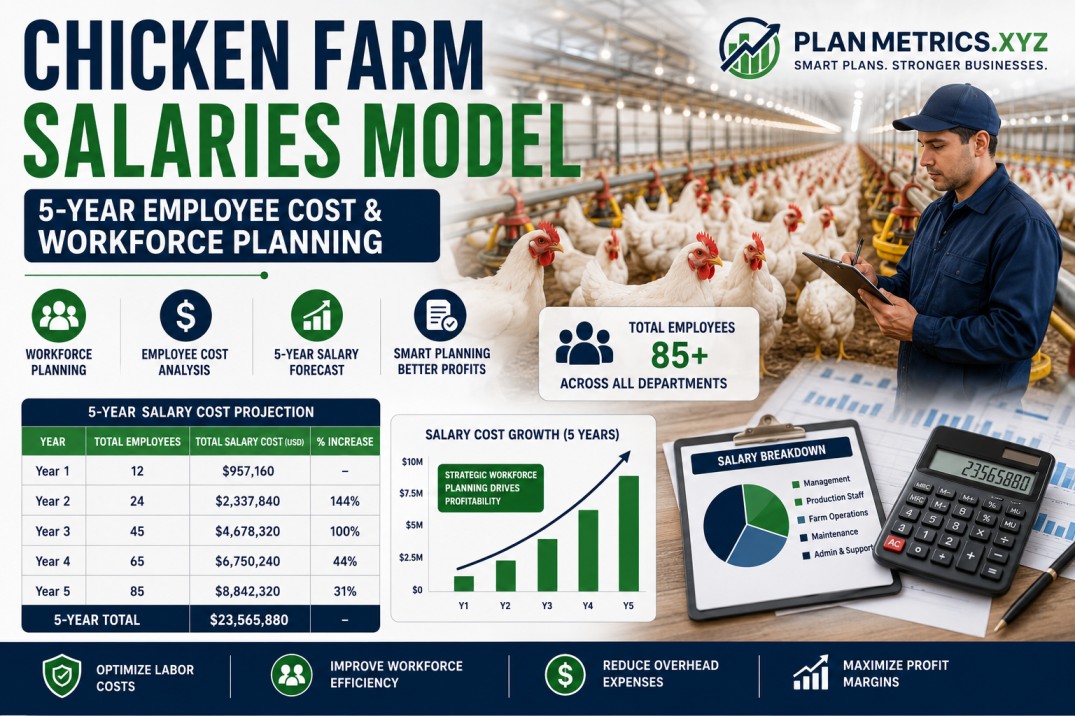
One thing I’ve noticed about poultry business plans is that everyone obsesses over feed costs and revenue projections — and then completely underestimates what a proper workforce actually costs. Salaries are usually the second or third largest operating expense in any commercial farm, and if you haven’t planned them properly by role, by headcount, and by year, your entire financial model is built on shaky ground.
This Salaries Model breaks down exactly who you need to hire, how many of them, what they earn, and how those costs grow across all 5 years of the operation. It’s one of the most detailed sections of the financial plan — and one of the most important.
Salary Structure Overview
The model covers 9 employee categories with annual salary increases of 10% in Year 2 and 20% in each of Years 3, 4, and 5. Two additional fixed costs — Government Levy and Insurance — are also included in the total salary expense.
Here’s the base monthly salary for each role:
| Role | Base Monthly Salary (Year 1) |
|---|---|
| Slaughtering Workers | $420 |
| Vessel Crew — Captain | $2,500 |
| Vessel Crew — Crew | $700 |
| Crane Operator | $1,500 |
| General Workers | $420 |
| Administrative Assistant | $1,500 |
| Directors | $19,300 |
| Accounts | $2,500 |
| Senior Staff | $1,500 |
Employee Headcount by Year
This is where the workforce planning story really unfolds. Watch how headcount scales with production:
Year 1 — Skeleton Crew Phase
| Role | Month 1–8 | Month 9–12 |
|---|---|---|
| Slaughtering Workers | 0 | 300 |
| Vessel Crew — Captain | 0 | 2 |
| Vessel Crew — Crew | 0 | 2 |
| Crane Operator | 0 | 1 |
| General Workers | 0 | 10 |
| Administrative Assistant | 1 | 1 |
| Directors | 1 | 1 |
| Accounts | 2 | 2 |
| Senior Staff | 2 | 2 |
| Total Employees | 6 | 321 |
The jump from 6 to 321 employees in Month 9 is dramatic — and deliberate. For the first 8 months, only the core management team is in place: 1 administrative assistant, 1 director, 2 accounts staff, and 2 senior staff. These 6 people manage setup, procurement, regulatory compliance, and pre-opening preparations.
Then Month 9 arrives and 315 operational staff join in one wave — primarily 300 slaughtering workers plus vessel crew, crane operator, and general workers. They need to be hired, onboarded, and trained before first production begins in Year 2.
Year 2 — First Production Year
| Role | Headcount | Monthly Salary |
|---|---|---|
| Slaughtering Workers | 300 | $462 |
| Vessel Crew — Captain | 2 | $2,750 |
| Vessel Crew — Crew | 2 | $770 |
| Crane Operator | 1 | $1,650 |
| General Workers | 10 | $462 |
| Administrative Assistant | 1 | $1,650 |
| Directors | 1 | $21,230 |
| Accounts | 2 | $2,750 |
| Senior Staff | 2 | $1,650 |
| Total Employees | 321 | — |
Headcount holds steady at 321 in Year 2 — no new hires, just a 10% salary increase across all roles. The operation runs at the same team size but with higher production volume as cycles optimize.
Year 3 — Scale-Up Phase
| Role | Headcount | Monthly Salary |
|---|---|---|
| Slaughtering Workers | 600 | $508 |
| Vessel Crew — Captain | 4 | $3,025 |
| Vessel Crew — Crew | 4 | $847 |
| Crane Operator | 2 | $1,815 |
| General Workers | 20 | $508 |
| Administrative Assistant | 2 | $1,815 |
| Directors | 2 | $23,353 |
| Accounts | 4 | $3,025 |
| Senior Staff | 4 | $1,815 |
| Total Employees | 642 | — |
Year 3 doubles the workforce — from 321 to 642 employees. This aligns perfectly with production volume tripling from Year 2 levels. Every operational role doubles: slaughtering workers go from 300 to 600, vessel crew from 2 to 4, general workers from 10 to 20. Management roles also double — directors, accounts, senior staff, and admin assistants all increase to support the larger operation. Salary rates get a 20% increase on top of Year 2 levels.
Year 4 — Optimized Operations
| Role | Headcount | Monthly Salary |
|---|---|---|
| Slaughtering Workers | 600 | $559 |
| Vessel Crew — Captain | 4 | $3,328 |
| Vessel Crew — Crew | 4 | $932 |
| Crane Operator | 2 | $1,997 |
| General Workers | 20 | $559 |
| Administrative Assistant | 2 | $1,997 |
| Directors | 2 | $25,688 |
| Accounts | 5 | $3,328 |
| Senior Staff | 4 | $1,997 |
| Total Employees | 643 | — |
Year 4 adds just 1 employee to the 642-strong Year 3 team — one additional Accounts staff member (going from 4 to 5). Everything else holds at Year 3 headcount. The 20% salary increase applies across all roles. This is the efficiency phase: same workforce, higher salaries, and production held at maximum capacity.
Year 5 — Mature Operations
| Role | Headcount | Monthly Salary |
|---|---|---|
| Slaughtering Workers | 600 | $615 |
| Vessel Crew — Captain | 4 | $3,660 |
| Vessel Crew — Crew | 4 | $1,025 |
| Crane Operator | 2 | $2,196 |
| General Workers | 20 | $615 |
| Administrative Assistant | 2 | $2,196 |
| Directors | 2 | $28,257 |
| Accounts | 5 | $3,660 |
| Senior Staff | 4 | $2,196 |
| Total Employees | 643 | — |
Year 5 is identical to Year 4 in headcount — 643 employees — with another 20% salary increase applied. The workforce is stable, experienced, and running at full operational efficiency.
Salary Cost Analysis by Role — All 5 Years
Slaughtering Workers
| Year | Monthly Cost | Annual Total |
|---|---|---|
| Year 1 | $0 → $126,000 | $504,000 |
| Year 2 | $138,600 | $1,663,200 |
| Year 3 | $304,920 | $3,659,040 |
| Year 4 | $335,412 | $4,024,944 |
| Year 5 | $368,953 | $4,427,438 |
Slaughtering workers are by far the largest salary line in this model — 300 workers in Year 1 (from Month 9), scaling to 600 from Year 3 onward. Their collective cost grows from $504,000 in Year 1 to $4,427,438 in Year 5. This is the workforce that physically processes every bird — their productivity and retention directly impacts production output.
Directors
| Year | Monthly Cost | Annual Total |
|---|---|---|
| Year 1 | $19,300 | $231,600 |
| Year 2 | $21,230 | $254,760 |
| Year 3 | $46,706 | $560,472 |
| Year 4 | $51,377 | $616,519 |
| Year 5 | $56,514 | $678,171 |
Directors are the highest-paid individual employees at $19,300/month base salary in Year 1, rising to $28,257/month by Year 5. The doubling from 1 to 2 directors in Year 3 reflects the need for expanded leadership as the workforce and production scale simultaneously. By Year 5, directors collectively cost $678,171 annually.
Accounts Staff
| Year | Monthly Cost | Annual Total |
|---|---|---|
| Year 1 | $5,000 | $60,000 |
| Year 2 | $5,500 | $66,000 |
| Year 3 | $12,100 | $145,200 |
| Year 4 | $16,638 | $199,650 |
| Year 5 | $18,301 | $219,615 |
Accounts grows from 2 staff in Years 1–2 to 4 in Year 3 and 5 in Year 4 — reflecting the growing complexity of managing a $168 million revenue operation with hundreds of employees and multiple loan obligations.
All Other Roles — 5-Year Annual Cost Summary
| Role | Year 1 | Year 2 | Year 3 | Year 4 | Year 5 |
|---|---|---|---|---|---|
| Vessel Crew — Captain | $20,000 | $66,000 | $145,200 | $159,720 | $175,692 |
| Vessel Crew — Crew | $5,600 | $18,480 | $40,656 | $44,722 | $49,194 |
| Crane Operator | $6,000 | $19,800 | $43,560 | $47,916 | $52,708 |
| General Workers | $16,800 | $55,440 | $121,968 | $134,165 | $147,581 |
| Admin Assistant | $18,000 | $19,800 | $43,560 | $47,916 | $52,708 |
| Senior Staff | $36,000 | $39,600 | $87,120 | $95,832 | $105,415 |
Government Levy and Insurance
Two additional fixed costs are included in the total salary expense beyond base wages:
Government Levy
$1,600 per month — fixed across all 60 months
| Year | Monthly | Annual Total |
|---|---|---|
| All Years | $1,600 | $19,200 |
The Government Levy of $800 per unit with 2 units gives a flat $1,600/month. This likely represents a mandatory payroll-based government contribution — consistent across all 5 years regardless of headcount changes.
Insurance
| Period | Monthly Cost | Annual Total |
|---|---|---|
| Year 1, Months 1–8 | $180 | — |
| Year 1, Months 9–12 | $9,630 | $39,960 |
| Year 2 | $9,630 | $115,560 |
| Year 3 | $19,260 | $231,120 |
| Year 4 | $19,290 | $231,480 |
| Year 5 | $19,290 | $231,480 |
Insurance at $30 per employee per month scales directly with headcount. Months 1–8 with just 6 employees costs only $180/month. Month 9 when 321 employees join, it jumps to $9,630/month. Year 3 doubling of headcount pushes it to $19,260/month. Years 4 and 5 add just $30 more from the one additional accounts staff member.
This is workers’ compensation and employee liability insurance — an unavoidable cost that scales predictably with your team size.
Total Salaries Expense — 5-Year Summary
| Year | Monthly Salary Cost | Annual Total |
|---|---|---|
| Year 1 (M1–8) | $30,580 | — |
| Year 1 (M9–12) | $178,130 | $957,160 |
| Year 2 | $194,820 | $2,337,840 |
| Year 3 | $424,758 | $5,097,096 |
| Year 4 | $468,505 | $5,622,064 |
| Year 5 | $513,267 | $6,159,202 |
5-Year Total Salary Expense: $20,173,362
Key Workforce Insights
The Month 9 hiring wave is your biggest operational risk in Year 1. Bringing 315 people on board in a single month requires pre-planned recruitment, documented onboarding processes, and training programs ready to go. Delays in hiring push your production start date — and therefore your first revenue — later. Budget extra time and a small contingency fund for this phase.
Salary growth at 10–20% per year is aggressive. In stable economies, 5% annual salary increases are standard. The 20% year-on-year increases in Years 3, 4, and 5 are clearly intentional — either reflecting a high-inflation environment, a deliberate strategy to attract and retain quality staff, or a market where skilled poultry workers command premium wages. Whatever the reason, this aggressive salary escalation is built into the model and accounted for in the profitability projections.
Director compensation is well-structured. Starting at $19,300/month and growing to $28,257 by Year 5, the director package is competitive for senior leadership of a $168 million revenue operation. What’s notable is that it doubles to 2 directors in Year 3 — reflecting the recognition that scaling from 321 to 642 employees requires dedicated leadership bandwidth, not just more workers.
Slaughtering workers dominate the salary bill. 600 workers at $615/month in Year 5 represents over 70% of the total headcount. Their collective cost ($4,427,438/year in Year 5) is nearly 7x the director cost and represents the single biggest salary line item. Efficient management of this workforce — scheduling, supervision, retention — has the largest impact on overall salary cost control.
Insurance scales predictably. At $30 per employee per month, insurance is completely foreseeable. As you scale headcount, just multiply: 643 employees × $30 = $19,290/month. No surprises here.
Building a Salaries Model like this before you hire your first employee is one of the most valuable exercises in poultry business planning. It forces you to think through every role you need, when you need them, and what they’ll cost — not just in Year 1, but across the full life of your business plan.