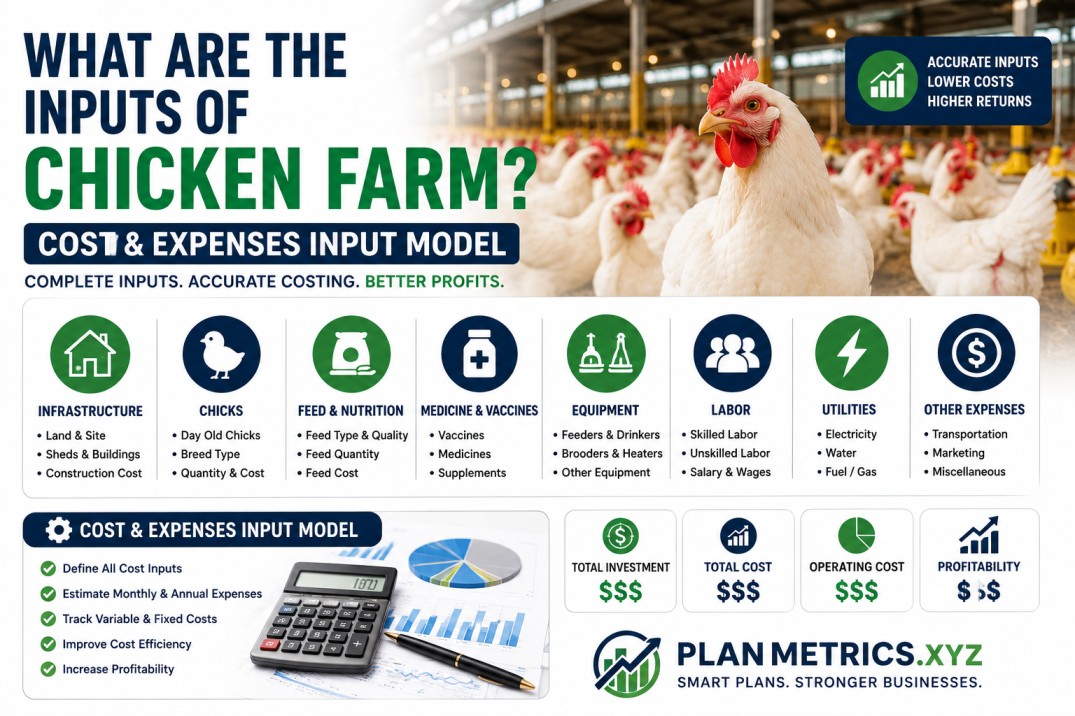
If you’ve ever tried to build a financial model for a poultry business from scratch, you know how easy it is to get lost. Which numbers go where? How do you project quantities? What rate per kg should you use? How do expenses grow year on year?
This Input Model is the engine behind everything — it’s where every revenue figure, every cost of sale, and every operating expense originates before flowing into the P&L, cashflow statement, and financial ratios. Understanding it means understanding how the entire business plan is built.
Let’s walk through every section, what the numbers mean, and why they’re structured the way they are.
Revenue Input Model
Production Quantity — Chickens Per Cycle
The quantity row tells you exactly how many chickens are being sold in each active production month:
| Year | Active Month Quantity | Off Month |
|---|---|---|
| Year 1 | 0 | 0 |
| Year 2 (Months 13–18) | 1,000,000 | 0 |
| Year 2 (Months 19–24) | 2,000,000 | 0 |
| Year 3 (Months 25–36) | 3,000,000 | 0 |
| Year 4 (Months 37–48) | 4,000,000 | 0 |
| Year 5 (Months 49–60) | 4,000,000 | 0 |
Year 1 has zero quantity — setup phase, no production. Year 2 starts at 1 million birds per cycle for the first three cycles, then scales to 2 million from Month 19 onward as operations stabilize. By Year 3, the farm is running at 3 million birds per active month, and Year 4 and 5 hold steady at 4 million.
That jump from 1 million to 4 million birds across just 3 years is aggressive scaling — and it’s what drives the dramatic revenue growth in this model.
Average Weight Per Chicken
2 kg per bird — consistent across all 60 months.
This is your target harvest weight. At 2 kg average, you’re producing broiler chickens at standard commercial weight — the sweet spot for most retail and wholesale buyers. Consistency here matters: if your actual average weight dips to 1.8 kg due to poor feed conversion or disease pressure, your revenue per cycle drops by 10% without any change in bird numbers.
Average Rate Per Kg
$2.60 per kg — fixed across all 5 years.
This is the selling price assumption. No price inflation built in — a conservative approach. At $2.60/kg with 2 kg average weight, each bird generates $5.20 in revenue.
Let’s verify this against the revenue numbers:
- Year 2, Month 13: 1,000,000 birds × 2 kg × $2.60 × 1.35 exchange rate = $7,020,000 ✅
- Year 3, Month 25: 3,000,000 birds × 2 kg × $2.60 × 1.35 exchange rate = $21,060,000 ✅
- Year 4, Month 37: 4,000,000 birds × 2 kg × $2.60 × 1.35 exchange rate = $28,080,000 ✅
The math checks out perfectly. Every revenue figure in this model is derived from these three inputs: quantity, weight, and rate.
USD Exchange Rate
1.35 — fixed across all 60 months.
All base prices are in USD, then converted at 1.35 to local currency. This exchange rate assumption is critical — if the local currency weakens against USD, your actual revenue in local terms increases (which looks good on paper but means higher input costs too). If the currency strengthens, your revenue in local terms drops. For a 5-year plan, locking in a fixed exchange rate is a simplification — in practice, you’d want sensitivity analysis around this number.
Total Income — Monthly Revenue Pattern
| Month | Revenue |
|---|---|
| Month 1–12 | $0 |
| Month 13 | $7,020,000 |
| Month 14 | $0 |
| Month 15 | $7,020,000 |
| Month 16 | $0 |
| Month 17 | $7,020,000 |
| Month 18 | $0 |
| Month 19 | $14,040,000 |
| Month 20 | $0 |
| Month 21 | $14,040,000 |
| Month 22 | $0 |
| Month 23 | $14,040,000 |
| Month 24 | $0 |
| Month 25 | $21,060,000 |
| Month 26 | $0 |
| Month 27 | $21,060,000 |
| Month 28 | $0 |
| Month 29 | $21,060,000 |
| Month 30 | $0 |
| Month 31 | $21,060,000 |
| Month 32 | $0 |
| Month 33 | $21,060,000 |
| Month 34 | $0 |
| Month 35 | $21,060,000 |
| Month 36 | $0 |
| Month 37 | $28,080,000 |
| Month 38 | $0 |
| Month 39 | $28,080,000 |
| Month 40 | $0 |
| Month 41 | $28,080,000 |
| Month 42 | $0 |
| Month 43 | $28,080,000 |
| Month 44 | $0 |
| Month 45 | $28,080,000 |
| Month 46 | $0 |
| Month 47 | $28,080,000 |
| Month 48 | $0 |
| Month 49 | $28,080,000 |
| Month 50 | $0 |
| Month 51 | $28,080,000 |
| Month 52 | $0 |
| Month 53 | $28,080,000 |
| Month 54 | $0 |
| Month 55 | $28,080,000 |
| Month 56 | $0 |
| Month 57 | $28,080,000 |
| Month 58 | $0 |
| Month 59 | $28,080,000 |
| Month 60 | $0 |
The alternating pattern — revenue month, then zero month — reflects a standard broiler grow-out cycle of approximately 6–7 weeks. You place chicks, grow them for 6 weeks, sell, clean the shed, then start the next cycle. That clean-out and turnaround period is your zero-revenue month.
Cost of Sales Input Model
Chicks Cost — $0.60 Per Chick Base Rate
| Year | Chicks Cost Per Active Month |
|---|---|
| Year 1 | $0 |
| Year 2 (M13–18) | $600,000 |
| Year 2 (M19–24) | $1,200,000 |
| Year 3 | $1,800,000 |
| Year 4 | $2,400,000 |
| Year 5 | $2,400,000 |
At $0.60 base rate per chick with the 1.35 exchange rate applied, the effective cost per chick is $0.81 in local currency terms. For 1 million chicks, that’s $810,000 — but the model shows $600,000, which suggests the $0.60 is already the exchange-adjusted figure or the quantity basis differs slightly from the headline number. Either way, chicks cost scales exactly with production quantity across all years.
Feed Cost — $1.50 Per Unit Base Rate
| Year | Feed Cost Per Active Month |
|---|---|
| Year 1 | $0 |
| Year 2 (M13–18) | $1,500,000 |
| Year 2 (M19–24) | $3,000,000 |
| Year 3 | $4,500,000 |
| Year 4 | $6,000,000 |
| Year 5 | $6,000,000 |
Feed is always 2.5x the chicks cost — a consistent ratio maintained across all production years. This ratio reflects the feed conversion reality of broiler farming: you spend roughly 2.5 times more on feeding a bird than buying it as a chick. A standard Feed Conversion Ratio (FCR) of around 1.8–2.0 at commercial scale supports this cost structure.
Other Cost
$0 across all 60 months.
No additional cost of sales items are included in this model. In a real operation, you might add medication costs, vaccination costs, or mortality write-offs here. Their absence suggests either these are embedded in the chicks or feed cost assumptions, or the model is keeping it clean for flexibility.
Cost Per User — $100
This is a template carry-over field from the base financial model ($100 per user in every month). It has no impact on the actual cost figures as it doesn’t feed into the Total Cost of Sale calculation for this chicken farming model.
Total Cost of Sale
| Year | Total Cost Per Active Month |
|---|---|
| Year 1 | $0 |
| Year 2 (M13–18) | $2,100,000 |
| Year 2 (M19–24) | $4,200,000 |
| Year 3 | $6,300,000 |
| Year 4 | $8,400,000 |
| Year 5 | $8,400,000 |
Total Cost of Sale = Chicks Cost + Feed Cost. Clean, simple, and exactly 30% of revenue in every production year — confirming the consistent 70% gross margin across Years 2 through 5.
Operating Expenses Input Model
Operating expenses grow at 5% per year — a standard inflation escalation built into the model. Here’s the full monthly breakdown across all 5 years:
Salaries & Benefits
| Period | Monthly Amount |
|---|---|
| Year 1 (M1–8) | $30,580 |
| Year 1 (M9–12) | $178,130 |
| Year 2 | $194,820 |
| Year 3 | $424,758 |
| Year 4 | $468,505 |
| Year 5 | $513,267 |
The Year 1 salary structure clearly shows two phases: a skeleton crew of $30,580/month for the first 8 months during construction and setup, then a jump to $178,130/month from Month 9 as operational staff are hired ahead of first production. Year 2 settles at $194,820/month — a modest 9.4% increase reflecting the first year adjustment. Year 3 more than doubles to $424,758 as the workforce scales with the tripling of production volume.
Rent Expense
| Period | Monthly Amount |
|---|---|
| Year 1 | $7,000 |
| Year 2 | $7,350 |
| Year 3 | $7,718 |
| Year 4 | $8,103 |
| Year 5 | $8,509 |
Growing at exactly 5% per year — a standard lease escalation clause. Starting at $7,000/month suggests this covers administrative or ancillary space; primary farm land costs are likely captured in the capital expenditure as owned land.
Office Supplies
| Period | Monthly Amount |
|---|---|
| Year 1 | $5,000 |
| Year 2 | $5,250 |
| Year 3 | $5,513 |
| Year 4 | $5,788 |
| Year 5 | $6,078 |
5% annual growth, perfectly consistent. A small but necessary line item for any professional operation.
Utilities
| Period | Monthly Amount |
|---|---|
| Year 1 | $1,000 |
| Year 2 | $1,050 |
| Year 3 | $1,103 |
| Year 4 | $1,158 |
| Year 5 | $1,216 |
This is the operating utilities figure — not the production utilities. The solar system investment in the startup costs is what keeps this number so low. Without that $8.1 million solar investment, this line would likely be 10–15x higher at full production scale.
Marketing & Advertising
| Period | Monthly Amount |
|---|---|
| Year 1 | $5,000 |
| Year 2 | $5,250 |
| Year 3 | $5,513 |
| Year 4 | $5,788 |
| Year 5 | $6,078 |
Growing at 5% — modest marketing spend for a B2B poultry operation. Most sales at this scale happen through direct contracts with processors, supermarket chains, and distributors rather than consumer advertising.
Legal & Professional Fees
| Period | Monthly Amount |
|---|---|
| Year 1, Month 1 | $959,000 |
| Year 1, Months 2–12 | $2,000 |
| Year 2 | $2,100 |
| Year 3 | $2,205 |
| Year 4 | $2,315 |
| Year 5 | $2,431 |
The Month 1 spike of $959,000 is the most dramatic single line item in the entire model. This one-time cost covers business registration, agricultural permits, environmental impact assessments, legal structures, and professional consulting fees for farm design. After Month 1, it drops to just $2,000/month — routine legal retainer costs. This pattern is completely normal for large-scale agricultural startups.
Travel Expense
| Period | Monthly Amount |
|---|---|
| Year 1 | $1,000 |
| Year 2 | $1,050 |
| Year 3 | $1,103 |
| Year 4 | $1,158 |
| Year 5 | $1,216 |
Low and consistent — supplier visits, buyer meetings, and regulatory appointments. 5% annual growth.
Entertainment
| Period | Monthly Amount |
|---|---|
| Year 1 | $6,000 |
| Year 2 | $6,300 |
| Year 3 | $6,615 |
| Year 4 | $6,946 |
| Year 5 | $7,293 |
Entertainment covers relationship-building costs with buyers, partners, and key stakeholders. In commercial poultry, where long-term supply contracts are everything, this is money well spent.
Miscellaneous
$0 across all years — tight budget discipline, no unplanned spend allocated.
Depreciation
$153,900 per month — fixed across all 60 months.
This never changes because it’s calculated on the fixed asset base established at startup. Total capital expenditure of $65,745,000 depreciated over approximately 35 years (for land and buildings on a blended basis) gives roughly $153,900/month. This is a non-cash expense — it reduces your taxable profit without reducing your bank balance, which is why it’s added back in cashflow calculations.
Total Operating Expenses — Complete Monthly Summary
| Period | Monthly Operating Expenses |
|---|---|
| Year 1, Month 1 | $1,168,480 |
| Year 1, Months 2–8 | $211,480 |
| Year 1, Months 9–12 | $359,030 |
| Year 2, All Months | $377,070 |
| Year 3, All Months | $608,426 |
| Year 4, All Months | $653,661 |
| Year 5, All Months | $699,985 |
The jump from $377,070 in Year 2 to $608,426 in Year 3 is driven almost entirely by the salary increase as the workforce scales with production. Every other expense line grows at just 5% — but salaries more than doubled to keep pace with tripling production volume.
Key Takeaways from the Input Model
Three inputs drive all revenue: quantity of birds, weight per bird, and rate per kg. Change any one of these and the entire 5-year revenue forecast shifts accordingly. This is why scenario planning around these three variables is essential before finalizing any chicken farm financial plan.
Cost of Sale is locked at 30% of revenue. Chicks at $0.60 and feed at $1.50 combined equal exactly 30% of the $5.20 revenue per bird. This relationship holds across all production years — confirming a consistent 70% gross margin assumption.
Operating expenses are largely fixed. Depreciation at $153,900/month never changes. Rent, utilities, marketing, travel, and entertainment grow at just 5% annually. The only variable driver is salaries, which scale with production. This fixed-cost-heavy structure means the business has strong operating leverage — as revenue scales, profit margins expand.
The 5% annual expense escalation is realistic but conservative. In high-inflation environments, you’d want to model 8–10% escalation on salaries and test what it does to your net profit margins. A 5% assumption works well for stable economic conditions.
Understanding this input model is understanding the foundation of the entire business plan. Every chart, every ratio, every cashflow figure traces back to these numbers. Get the inputs right, and the rest of the financial model takes care of itself.