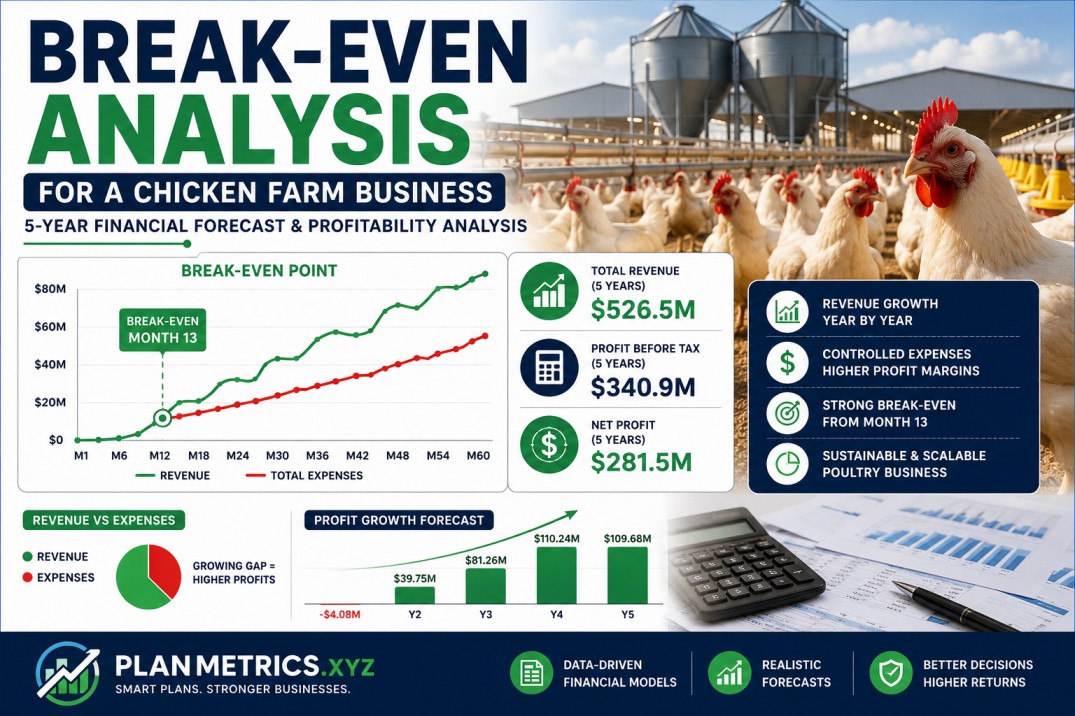
One of the most important questions any poultry investor asks before putting money into a farm is: “When will I actually start making money?” That’s exactly what a Break-Even Analysis answers. It tells you the precise point where your revenue covers all your expenses — not a dollar of profit yet, but no loss either. The moment you cross that line, every sale after it starts building real wealth.
Looking at this chicken farm’s monthly data across all 5 years, the break-even story is very clear — and honestly, more encouraging than most first-time operators expect.
What the Break-Even Data Shows
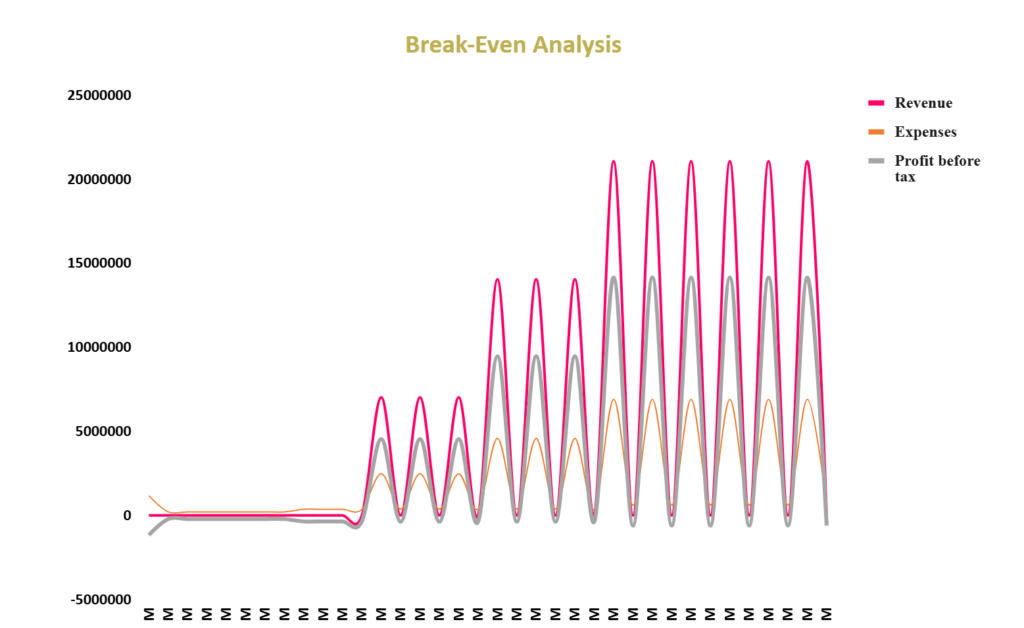
The analysis tracks three things month by month:
- Revenue — what comes in from chicken sales
- Expenses — total costs including production and operating expenses
- Profit Before Tax — the difference between the two
Let’s go through it year by year.
Year 1 — The Pre-Revenue Phase
| Month | Revenue | Expenses | Profit Before Tax |
|---|---|---|---|
| Month 1 | $0 | $1,168,480 | -$1,168,480 |
| Month 2 | $0 | $211,480 | -$211,480 |
| Month 3 | $0 | $211,480 | -$211,480 |
| Month 4 | $0 | $211,480 | -$211,480 |
| Month 5 | $0 | $211,480 | -$211,480 |
| Month 6 | $0 | $211,480 | -$211,480 |
| Month 7 | $0 | $211,480 | -$211,480 |
| Month 8 | $0 | $211,480 | -$211,480 |
| Month 9 | $0 | $359,030 | -$359,030 |
| Month 10 | $0 | $359,030 | -$359,030 |
| Month 11 | $0 | $359,030 | -$359,030 |
| Month 12 | $0 | $359,030 | -$359,030 |
Zero revenue, expenses running every single month. The break-even point is not even in sight in Year 1 — and that’s completely expected. This is your setup and investment phase.
Month 1 shows the highest expense spike at $1,168,480 due to one-time legal, licensing, and setup costs. From Month 2 to Month 8, expenses stabilize at $211,480 per month. Then from Month 9, they step up to $359,030 as the team expands ahead of production launch.
Year 1 total loss: -$4,084,960
The entire year is below break-even — but it’s planned below break-even. Your funding should cover this gap completely before you start operations.
Year 2 — Break-Even Crossed for the First Time
This is where things get exciting. Month 13 is the first month revenue hits the account — and it immediately crosses break-even.
| Month | Revenue | Expenses | Profit Before Tax |
|---|---|---|---|
| Month 13 | $7,020,000 | $2,477,070 | +$4,542,930 |
| Month 14 | $0 | $377,070 | -$377,070 |
| Month 15 | $7,020,000 | $2,477,070 | +$4,542,930 |
| Month 16 | $0 | $377,070 | -$377,070 |
| Month 17 | $7,020,000 | $2,477,070 | +$4,542,930 |
| Month 18 | $0 | $377,070 | -$377,070 |
| Month 19 | $14,040,000 | $4,577,070 | +$9,462,930 |
| Month 20 | $0 | $377,070 | -$377,070 |
| Month 21 | $14,040,000 | $4,577,070 | +$9,462,930 |
| Month 22 | $0 | $377,070 | -$377,070 |
| Month 23 | $14,040,000 | $4,577,070 | +$9,462,930 |
| Month 24 | $0 | $377,070 | -$377,070 |
Notice the alternating pattern — revenue months are massively profitable, zero-revenue months run at a small loss of -$377,070. This reflects the poultry production cycle: you sell in one month, then spend the next cycle growing the next batch.
The break-even point is Month 13 — the very first month of production.
On an annual basis, Year 2 comfortably clears break-even with a Profit Before Tax of $39,755,160.
Year 3 — Deeper Into Profit Territory
| Month | Revenue | Expenses | Profit Before Tax |
|---|---|---|---|
| Month 25 | $21,060,000 | $6,908,426 | +$14,151,575 |
| Month 26 | $0 | $608,426 | -$608,426 |
| Month 27 | $21,060,000 | $6,908,426 | +$14,151,575 |
| Month 28 | $0 | $608,426 | -$608,426 |
| Month 29 | $21,060,000 | $6,908,426 | +$14,151,575 |
| Month 30 | $0 | $608,426 | -$608,426 |
| Month 31 | $21,060,000 | $6,908,426 | +$14,151,575 |
| Month 32 | $0 | $608,426 | -$608,426 |
| Month 33 | $21,060,000 | $6,908,426 | +$14,151,575 |
| Month 34 | $0 | $608,426 | -$608,426 |
| Month 35 | $21,060,000 | $6,908,426 | +$14,151,575 |
| Month 36 | $0 | $608,426 | -$608,426 |
Revenue per active month jumps to $21,060,000 — a full 50% increase over the second half of Year 2. Expenses on active months rise to $6,908,426, but profit before tax on those months reaches $14,151,575.
The gap between revenue and expenses on production months is widening — which is exactly the scaling effect you want to see.
Year 3 Profit Before Tax: $81,258,894
Year 4 — Peak Growth, Strong Break-Even Buffer
| Month | Revenue | Expenses | Profit Before Tax |
|---|---|---|---|
| Month 37 | $28,080,000 | $9,053,661 | +$19,026,339 |
| Month 38 | $0 | $653,661 | -$653,661 |
| Month 39 | $28,080,000 | $9,053,661 | +$19,026,339 |
| Month 40 | $0 | $653,661 | -$653,661 |
| Month 41 | $28,080,000 | $9,053,661 | +$19,026,339 |
| Month 42 | $0 | $653,661 | -$653,661 |
| Month 43 | $28,080,000 | $9,053,661 | +$19,026,339 |
| Month 44 | $0 | $653,661 | -$653,661 |
| Month 45 | $28,080,000 | $9,053,661 | +$19,026,339 |
| Month 46 | $0 | $653,661 | -$653,661 |
| Month 47 | $28,080,000 | $9,053,661 | +$19,026,339 |
| Month 48 | $0 | $653,661 | -$653,661 |
Revenue per active month hits $28,080,000. Even in zero-revenue months, expenses are only $653,661 — a manageable holding cost between production cycles.
The break-even buffer on active months is now $19,026,339 — meaning revenue is more than 3x total expenses on production months. That’s a very comfortable margin of safety.
Year 4 Profit Before Tax: $110,236,066 — the highest across all 5 years.
Year 5 — Stable and Consistent Break-Even Performance
| Month | Revenue | Expenses | Profit Before Tax |
|---|---|---|---|
| Month 49 | $28,080,000 | $9,099,985 | +$18,980,015 |
| Month 50 | $0 | $699,985 | -$699,985 |
| Month 51 | $28,080,000 | $9,099,985 | +$18,980,015 |
| Month 52 | $0 | $699,985 | -$699,985 |
| Month 53 | $28,080,000 | $9,099,985 | +$18,980,015 |
| Month 54 | $0 | $699,985 | -$699,985 |
| Month 55 | $28,080,000 | $9,099,985 | +$18,980,015 |
| Month 56 | $0 | $699,985 | -$699,985 |
| Month 57 | $28,080,000 | $9,099,985 | +$18,980,015 |
| Month 58 | $0 | $699,985 | -$699,985 |
| Month 59 | $28,080,000 | $9,099,985 | +$18,980,015 |
| Month 60 | $0 | $699,985 | -$699,985 |
Year 5 revenue stays flat at Year 4 levels — capacity ceiling reached. Expenses nudge up slightly to $9,099,985 on active months and $699,985 on off months, reflecting modest salary increases.
Profit before tax per active month: $18,980,015 — marginally lower than Year 4 due to rising costs against flat revenue. Still exceptional performance.
Year 5 Profit Before Tax: $109,680,174
5-Year Break-Even Summary
| Year | Total Revenue | Total Expenses | Profit Before Tax | Break-Even Status |
|---|---|---|---|---|
| Year 1 | $0 | $4,084,960 | -$4,084,960 | ❌ Below Break-Even |
| Year 2 | $63,180,000 | $23,424,840 | +$39,755,160 | ✅ Break-Even Crossed |
| Year 3 | $126,360,000 | $45,101,106 | +$81,258,894 | ✅ Strongly Profitable |
| Year 4 | $168,480,000 | $58,243,934 | +$110,236,066 | ✅ Peak Profitability |
| Year 5 | $168,480,000 | $58,799,826 | +$109,680,174 | ✅ Stable & Mature |
Key Break-Even Insights
Break-Even Month: Month 13 The farm crosses break-even in the very first month of production — Month 13. From that point forward, every production cycle generates substantial profit before tax.
The Alternating Cycle Reality Every off month (Month 14, 16, 18…) runs at a small loss — between -$377,070 in Year 2 and -$699,985 in Year 5. This is not a concern. It’s the natural cost of maintaining the operation between production cycles. The profit from active months more than covers these gaps many times over.
Expenses vs Revenue Gap Keeps Widening In Year 2 active months, revenue is about 2.8x expenses. By Year 4 and 5, revenue is about 3.1x expenses on active months. The business becomes more efficient relative to its revenue as it scales — a very positive trend.
What Puts Break-Even at Risk Three things could push the actual break-even point later than Month 13:
- Feed price spikes that increase your Cost of Sales beyond projections
- Production delays that push first revenue from Month 13 to Month 15 or 17
- Higher-than-expected mortality rates reducing revenue per cycle
Building a 15–20% buffer into your break-even calculations accounts for these real-world variables and gives you a more conservative — and safer — planning baseline.
Next Part Read Carefully